Conzen’s maps light up terrain of Chicago in new encyclopedia
By William HarmsNews Office
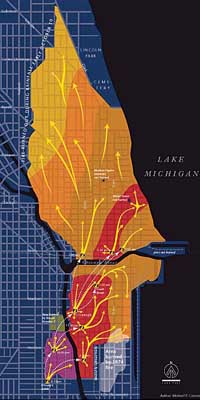
 This map from the encyclopedia shows the directional progress of the Chicago fire of October 1871. | |
Like a good picture, a map is worth a thousand words, or probably more in the case of a set of maps of Chicago that have been produced as part of the new Encyclopedia of Chicago.
The new volume, a publication of the University Press, is a project involving scholars throughout the city, including many at the University. One of the editors is James Grossman, a former faculty member in History.
Among the University researchers involved in the project is Michael Conzen, Chair of and Professor in the Committee on Geographical Studies, who was in charge of the maps.
The book has conventional maps, locating suburbs in relation to the city, for instance; it has historical maps, such as one of the Great Chicago Fire of 1871, which shows how the flames leaped northward to engage the city in a massive conflagration; and it has ethnic maps that show how the city is a quilt of immigrant groups, ranging from African Americans to Ukrainians.
But more importantly, the encyclopedia also offers maps with information that people usually do not look for on maps. These maps enhance understanding by showing people how events happened in a definable space.
The subjects touch on the curiosity and pride of people who live in Chicago by identifying institutions and situations that have shaped the city and given it its personality.
A map of blues clubs, for example, shows how the popular music halls moved, from dominating a strip of blocks that had been restricted to blacks and known as Bronzeville, to following the migration of African Americans into other neighborhoods on the West and South sides of the city and beyond into some white entertainment districts.
Other maps show how commuting changed over time, beginning in 1854, when bankers walked or rode carriages to work and when grocers lived above their stores. As years passed, commuting again evolved from trains and mass transit that whisked people to their jobs, to the 1950s when highways made it possible for residents who lived as far away as Rockford, Ill., Indiana and Wisconsin to drive to the Chicago area for work. That commute changed again by 1970, when increasing numbers of Chicago residents traveled to the suburbs for jobs, inventing the reverse commute.
Other maps in the encyclopedia tell the story of Chicago’s evolution to a world-class city by showing how people earned their living.
“Chicago began as a mercantile city,” said Conzen. “There was practically no manufacturing. After the fire, the city became a center for industry as well as the nation’s major railway hub.
“Look at these warehouses. You can tell how much of the nation’s commerce flowed through Chicago,” Conzen said, pointing to a map of 1930s Chicago, with a collar of storage structures encircling the outer edge of the Loop, where expensive new housing developments now flourish.
The manufacturing- and transportation-dependent job market gave way to a new Chicago, and by 1990, the city and suburbs had solidly become part of the information economy, with office buildings dominating a map that illustrates the region’s commercial patterns.
The maps are part of a package of information that makes the encyclopedia “the most advanced American city encyclopedia that’s ever been published,” Conzen said. Many of the historical maps are based on earlier versions, but with new scholarship, he added.
“The map of the Chicago fire is the most sophisticated one that has ever been done,” he said. A research assistant went through newspaper accounts and other records to gather eye-witness stories describing specific scenes of destruction at particular street intersections and other locations to help recreate and illustrate just how the fire leaped through its path of destruction.
The Chicago fire map also showed a strip of docks near where Navy Pier now stands; in this area people were able to draw enough water from the lake to protect some structures in the midst of the blaze.
The maps in the book were chosen for visual impact and to illustrate an article in the book. Conzen spent five years developing them by identifying historical maps that would illustrate a topic in the book and then creating new maps to reflect important changes in the city.
In the process of putting the maps together, Conzen spent quite a bit of time driving around the city. “That’s what geographers do. They want to understand spaces,” said Conzen, who became very familiar with Chicago and its neighborhoods. In a blink of an eye, he can describe, for instance, what the city’s Armenian-dominated neighborhood looks like: that aqua-colored square on the ethnic group map “is just behind O’Hare and is a group of tired-looking apartment buildings.”
But the squares on the quilt do not tell the whole story of Chicago and its ethnic heritage, Conzen is quick to point out. Another change in the city is growing integration, as former ethnic enclaves break down, people prosper and move, and new residents move in through gentrification and renewal.
Evidence of this integration can be seen in the encyclopedia’s current maps of Chicago, which depict dots for ethnic groups living together in close proximity. The dots, each representing 200 people, are scattered across the landscape. In some communities, the dots are of one color, but throughout Chicago and the suburbs, dots of different colors sit side-by-side, indicating that whites, Latinos, Asians and African Americans move into some of the same neighborhoods.
“We really wanted to make that clear, to show that the city in many ways is not so overwhelmingly divided into homogenous spaces,” he said.
![[Chronicle]](/images/sidebar_header_oct06.gif)